

← View All Microsoft 365 How-To Guides
Copilot in Excel can help you explore a worksheet, identify patterns, answer questions, and create charts or PivotTables. It can accelerate analysis, but important conclusions should always be checked against the underlying data.
Availability note: Copilot capabilities vary by license, Excel version, device, organization settings, and Microsoft rollout. This guide uses the Copilot pane, not the retired COPILOT worksheet function.
Before you begin
- Use a permitted workbook stored in OneDrive or SharePoint when required by your Excel experience.
- Make sure the data has clear column headings and no unnecessary blank rows or columns.
- Remove or anonymize sensitive data that is not needed for the analysis.
- Know the business question you are trying to answer.
How to prepare your data
-
Open the workbook and confirm that each column contains one type of information, such as date, customer, category, amount, or status.

Arrange the data in consistent columns with clear headings. -
Select the data and format it as an Excel table if it is not already a table. Choose Home > Format as Table, select a style, and confirm that the table has headers.

Format the data as a table and confirm that it has headers. -
Check for inconsistent dates, numbers stored as text, duplicate headings, and incomplete rows.
How to ask Copilot to analyze the data
-
Select the Copilot button to open the Copilot pane.
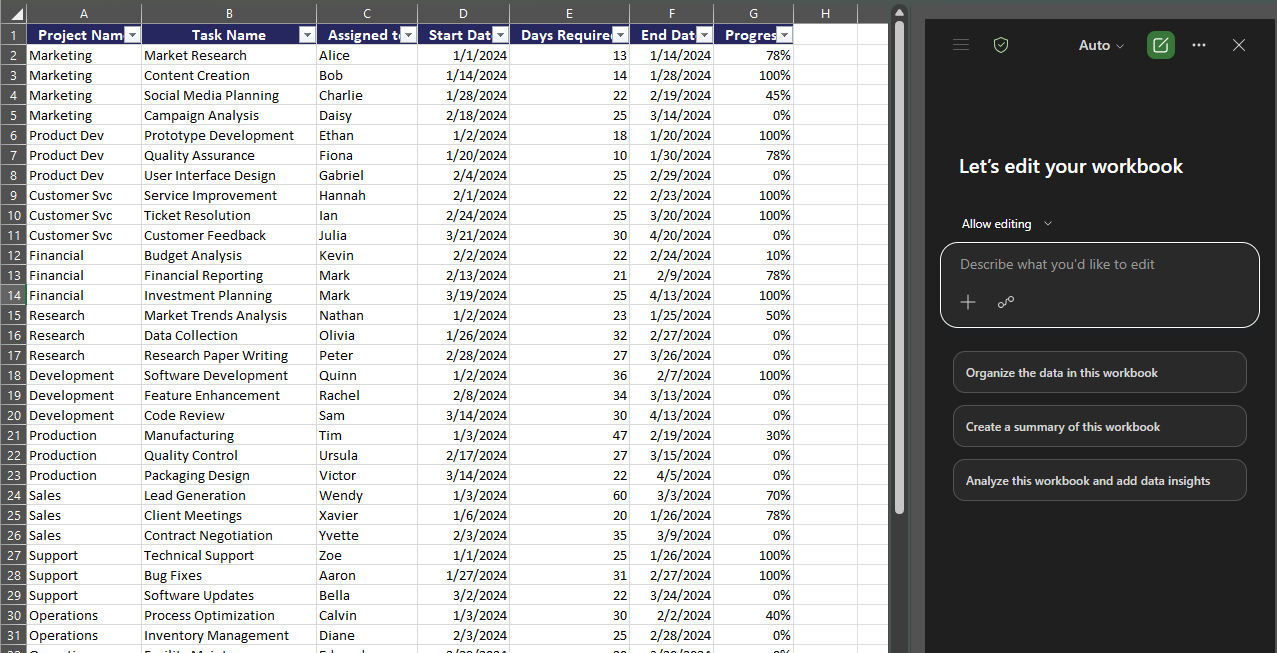
Open the Copilot pane from the Excel workbook. -
Ask a specific question and name the columns you want Copilot to use.
-
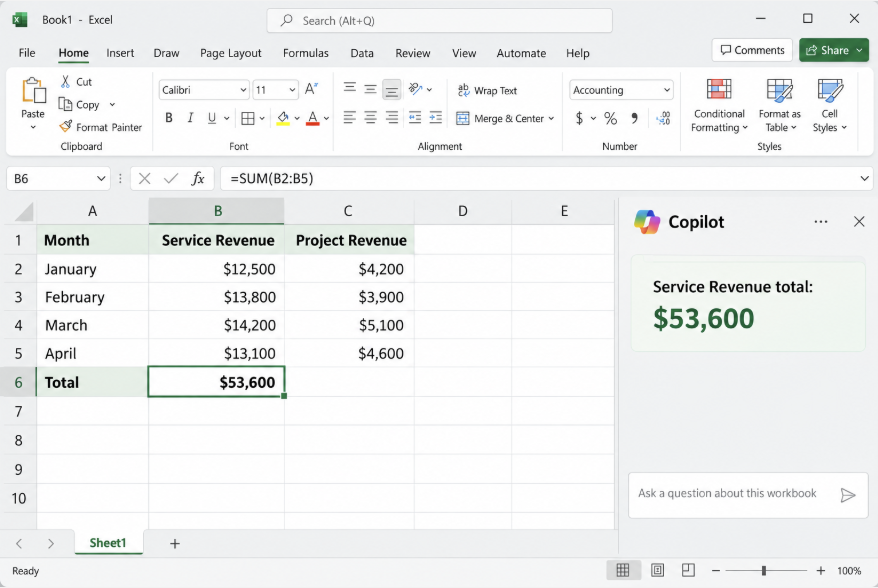
Review Copilot’s response, including any cited cells, formulas, tables, or charts.
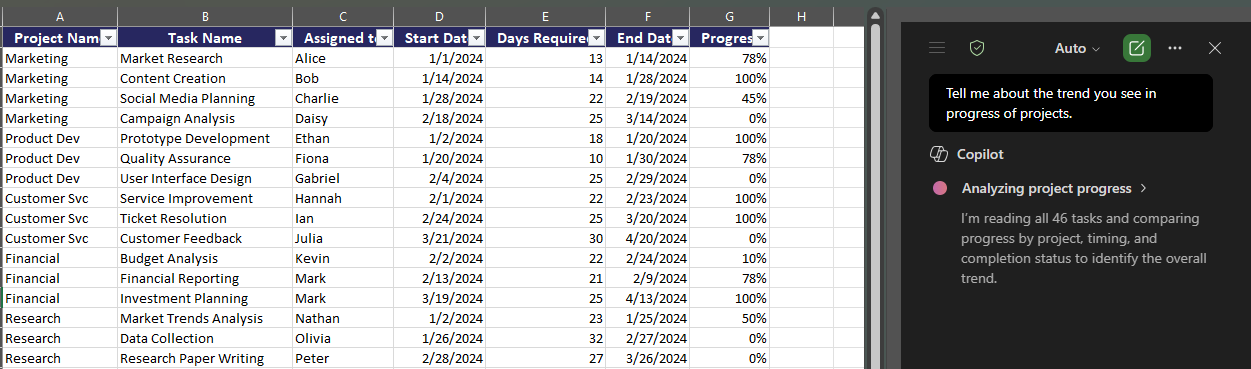
Review Copilot’s answer and the worksheet data it used. -
Ask a follow-up question if the answer is too broad. For example, request a comparison by month, location, service category, or account owner.
Useful prompts for business analysis
- “Summarize the monthly revenue trend using the Date and Revenue columns. Identify the three largest changes.”
- “Compare average response time by Service Category. Show the calculation used.”
- “Identify possible duplicates based on Company Name and Email Address. Do not delete anything.”
- “Create a chart showing total sales by month and explain any visible outliers.”
How to create a chart with Copilot
-
Ask Copilot to create a specific chart and identify the fields for the horizontal and vertical axes.
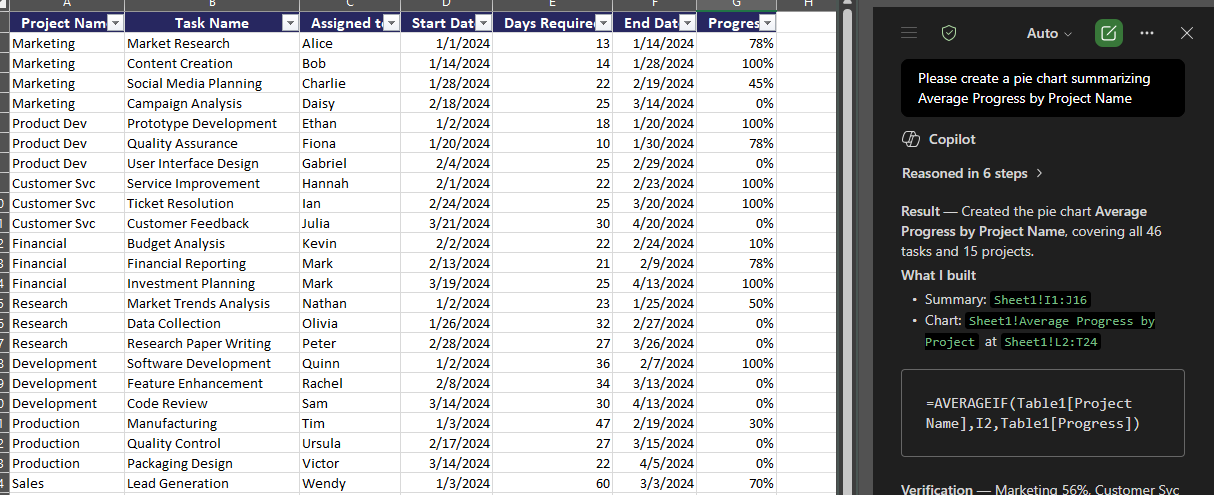
Describe the chart and identify the fields Copilot should use. -
Review the proposed chart, labels, filters, and aggregation method.
-
Insert or keep the chart, then use Excel’s normal chart controls to revise the title, labels, colors, or data range.
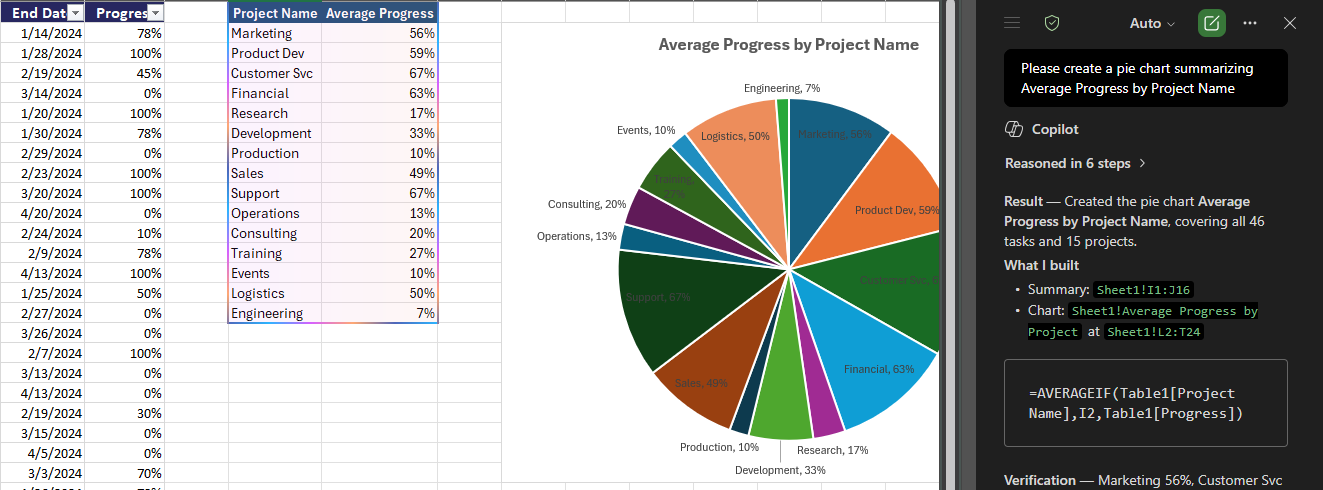
Check the chart’s source data, labels, filters, and calculations.
How to verify Copilot’s answer
- Confirm the correct table and columns were used.
- Recalculate at least one important total or average with a standard Excel formula or PivotTable.
- Check whether blanks, filtered rows, duplicates, or date ranges changed the result.
- Open the source rows behind any unusual finding.
- Do not make financial or operational decisions from a summary you have not verified.
Security reminder: Use sample or approved business data for demonstrations. Do not upload regulated, personal, payroll, medical, or confidential client data unless your organization has explicitly approved that use.
Official Microsoft guidance
- Get started with Copilot in Excel
- Visualize your data with Copilot in Excel
- Get direct answers to your data analysis questions
Frequently asked questions
Why does Copilot say it cannot analyze my data?
Check that the workbook is saved in the required Microsoft 365 location, the data has clear headings, and the correct work account is active. Converting the range to a table may also help.
Can Copilot change my worksheet?
Some Copilot modes can create or modify workbook content. Review proposed changes and keep a clean copy of important workbooks.
Is an AI-generated chart automatically accurate?
No. Confirm the source range, calculation, grouping, filters, and labels before using the chart.
Need help adopting Microsoft 365 Copilot?
PCC helps businesses configure licensing, permissions, security, and employee guidance for Copilot. Request a conversation with PCC.